We can run a health check of your existing data visualization solution. In this case, we look at it through the lens of best practices and advise on possible improvements.
Alternatively, we can help develop data visualization from scratch. In this case, we start with clarifying your business requirements, then we design a relevant conceptual solution and suggest a technology stack. With ScienceSoft being an authorized license reseller, our customers don’t need to involve any third parties to get visual software licenses (if any). Also, we do not limit ourselves to data visualization services, being always ready to offer our customers full-cycle data analytics services, such as data management, data warehouse (including ETL) and data marts development, big data consulting, advanced data analysis, and more.
Some of the data challenges we solve
- Not insightful reports force users to scroll through in an attempt to compare figures or spot trends. We believe that users should not waste their time and effort searching for insights; they should focus on making informed decisions, instead. That is why we consider data visualization as an indispensable part of the reporting process.
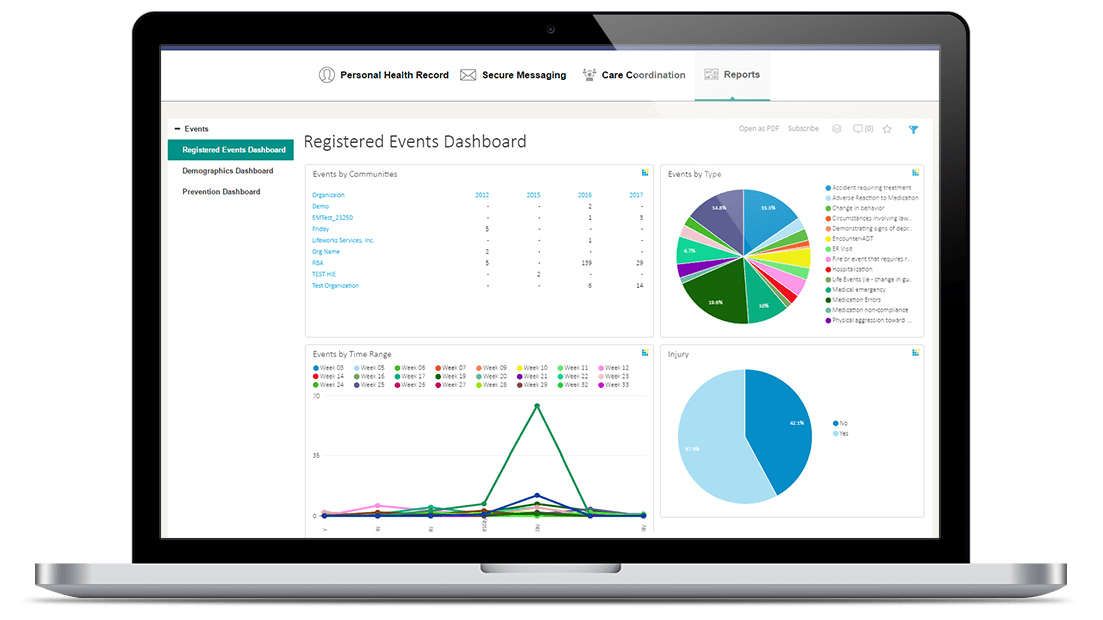
- Overloaded reports and dashboards. No matter the reason – for example, too many visual elements, data visualization types, or colors used – it makes reports and dashboards difficult to understand. We design ours carefully, making sure that trends or outliers are recognized immediately, colors are relevant and chart types are consistent.
- Disregarded user roles. We tailor reports and dashboards so that every user could focus on relevant data. For example, top management needs to stay on top of the information, and that is why we develop top-level reports and dashboards for them.
- Unanswered Why? We provide decision-makers with drill-down and filtering options so that they could answer their business questions by looking from different angles. For instance, a manager can look at the US sales in general, then rank them by state, then focus on those where sales are below the target.
- Insufficient flexibility. We do not limit our customers to a desktop version. Our data visualization services also cover the design and development of clear-cut dashboards for mobile users. As a part of this task, we solve data security challenges, as well as deliver a special UI/UX design.


